
Survival guide to data cleaning
In the previous article, we have discussed data cleaning from first principles. This article develops best practices to make the data cleaning more efficient and less tedious.

In the first article, we defined data cleaning as aligning data with reality, not making it look neat. Now let’s discuss best practices and methodology to make data cleaning less tedious, more efficient, and enjoyable (yes, it can be enjoyable!).
The process of data cleaning
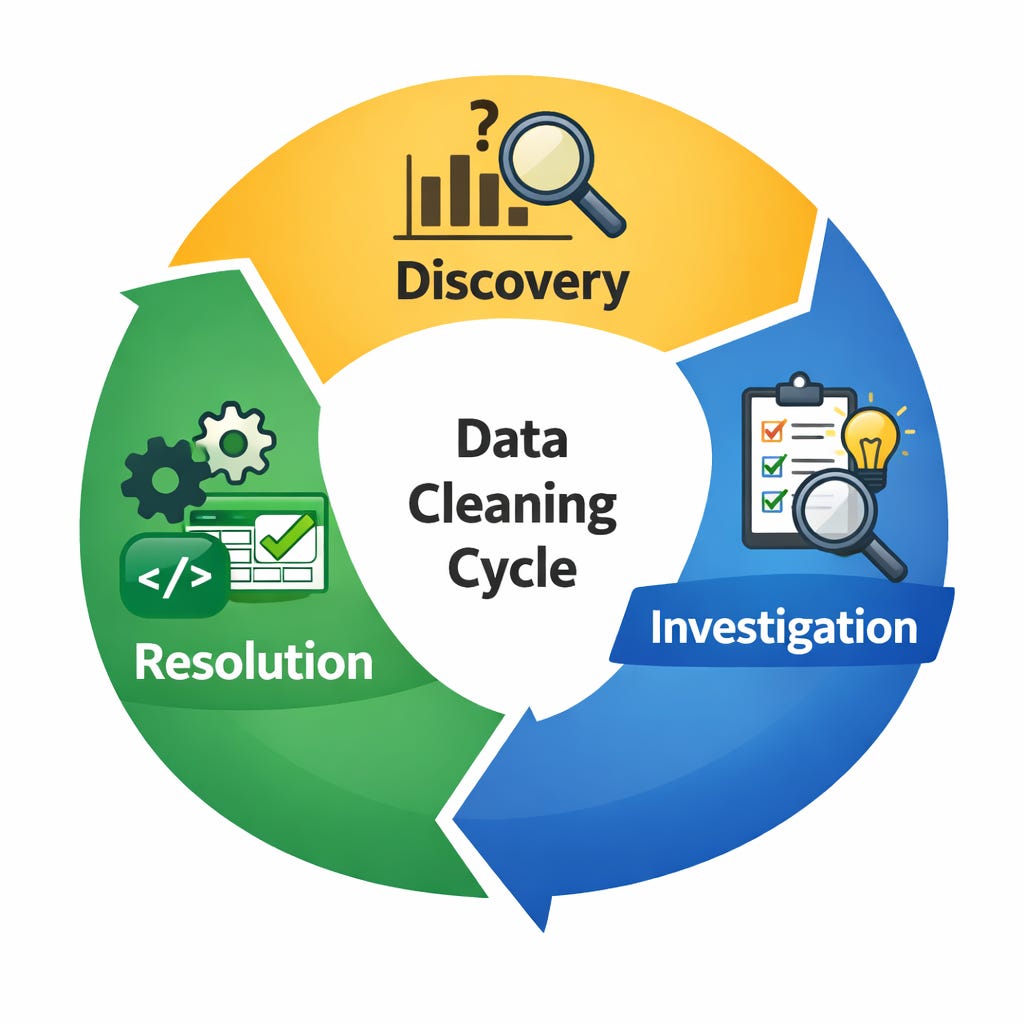
Data cleaning is an iterative loop.
Imagine you’re analyzing e-commerce orders and you notice something odd: your “daily revenue” chart has random spikes, and your model predicts revenue unusually well (too well).
You discover something surprising either by exploring data or observing strange modeling results. That’s Discovery.
You take a sample of spike days and inspect the rows. You notice duplicates: the same order appears twice with slightly different timestamps. You ask the team that owns the payment workflow. They tell you the system retries events when the gateway times out, and downstream ingestion sometimes records both the original and the retry.
You investigate what it means in the real system and whether it is a data issue to be fixed.
That’s Investigation: you’re turning a weird pattern into knowledge about how the real world and the system behave.
Then you implement a resolution: you deduplicate using an event ID, or you keep the latest status per order, and you add a flag that indicates “this row was collapsed from retries” so you preserve traceability. Then you resolve it in the dataset in a way that brings data closer to reality.
That’s Resolution: a technical change, grounded in meaning, that makes the dataset closer to reality.
It is a loop because, in most cases, it is very hard to get rid of all data issues at once.
What makes it long and tedious in reality
This loop sounds simple, but in reality it can take months, with a lot of back and forth with operations. The reasons are not technical:
Incomplete Discovery: At first anomaly, you (the data team) raise the issue, then go through the whole iteration. Fine, but one modeling step further, you hit another issue and go through it again. This is hard because everyone involved in the process starts to feel stuck in an endless loop. You get exhausted and demotivated because this is the nth time you are rerunning that modeling project.
Lack of support from other teams: Business teams don’t understand why your project stalls. IT teams are not available to debug the data pipeline. Each back-and-forth iteration requires people’s availability and setting up meetings.
Context switching and team rotation: Combining long iteration cycles and incomplete discovery is a recipe for disaster. You switch to other projects while waiting for other people’s availability. Then you realize the person in charge of the data pipeline left and was replaced. You have to explain everything again, but you yourself have lost some context, which makes it even worse.
Unfortunately, these are real stories, not horror fiction. That’s why having a clear methodology and best practices really helps streamline the process, reduce iteration cycles, and make it much more efficient and enjoyable.
Discovery: detect anomalies earlier, with less effort
Discovery is the most important step in the loop. You can’t resolve what you haven’t discovered, and late discovery is expensive: you end up rebuilding analysis, models, and trust.
Two misconceptions usually break discovery.
First, exploration isn’t just simple statistics. describe() and null rates help you orient, but real discovery asks: does this dataset behave like the real system? An “orders” table where order_id isn’t unique may not be dirty, it may be an event log. Miss that, and every join and KPI is off.
Second, exploration isn’t only the data team’s job. Data shows patterns, but the business explains what’s plausible. Negative amounts might be refunds or chargebacks, not errors. If you “clean them away,” you remove reality.
A simple sequence makes discovery both effective and enjoyable:
Quick technical first pass.
Check structure and formats, compute a few basic stats, inspect a sample. The goal is to avoid building on the wrong mental model.
Write a small set of project-critical assumptions.
If these are false, your result is unusable: “each row represents one order,” “timestamps are UTC,” “customer_id is stable,” “this status field has consistent meaning.”
Test assumptions with targeted checks.
Example: “each row is an order” → are order_ids duplicated? Do you see identical rows? Do totals look plausible?
Example: “timestamp is UTC” → does activity peak at realistic hours? Are there impossible sequences?
Validate with business and pipeline owners.
Unless you own deep system knowledge, you can’t validate assumptions alone. Bring a short, visual walkthrough: “here’s what I observed, here’s my hypothesis, is this expected?” Frame it as sharing insights, not reporting problems. This onboards the people you’ll need for investigation later and turns exploration into a clear, prioritized list of hypotheses.
If discovery is solid, you avoid bad surprises downstream. If not, you’ve earned the right to move to investigation.
Thanks for reading Jovyan AI’s blog! Subscribe for free to receive new posts and support my work.
Investigation: prioritization, cost–benefit trade-offs, and project management
Investigation is the expensive part because it sits at the boundary between data and the real system. The goal isn’t to make it instant, it’s to make it smooth.
Prioritize with an impact–cost trade-off
Now that you have a list of assumptions to check, prioritize them using cost vs. impact.
Cost: how much will it take to clarify the hypothesis (time, new extracts, coordination)?
Impact: if the assumption is wrong, what is the impact on the project, therefore on the business?
The key: do this exercise with the people who will help you investigate.
Don’t say: “80% of this column is missing.”
Say: “We may have a pipeline issue causing 80% missing values. If we fix it, our churn model should improve, which helps us retain more customers. How could we find out the root cause of missing data?”
This also helps you drop assumptions where the cost is high and the impact is low.
Project management and communication
Treat anomalies like product work. Track what you observed, your hypothesis, who can confirm it, the expected impact, and the estimated cost to resolve.
This keeps the team focused on what matters and avoids the “infinite list of weirdness” that kills projects.
Align early on a plan with stakeholders to synchronize availability. Break work into small steps and celebrate progress to build momentum.
Being able to say “we resolved 3 out of 5 issues, and the sales forecasting model improved by 10%” is powerful. People disengage less from lack of care than from lack of visible impact.
Resolution: implement changes that preserve meaning (and don’t create new problems)
Resolution is the technical step, but it’s also where teams accidentally destroy information. The dataset looks “cleaner,” but becomes less aligned with reality.
Keep raw data immutable, treat cleaned data as a product
Raw data is your reference point. Cleaned data is an interpretation layer that will evolve as understanding improves. If you overwrite raw inputs, you lose your audit trail and you make iteration harder.
In the retry example, you want the ability to show: “Before resolution we had 3% duplicates, after resolution we collapsed them, and here’s how.”
Resolve by issue, not by convenience
Organize transformations around the anomaly and the decision, not around columns or generic operations. A function called resolve_gateway_retries() is far more maintainable than a vague deduplicate_orders() buried among ten unrelated steps. It encodes why the transformation exists.
This is because assumptions will evolve. Later, if you want to update assumptions, it is much easier and less error-prone to organize that way than to find all the functions tied to assumption X.
Preserve uncertainty with flags, not silence
If you impute a value, keep a was_imputed flag. If you drop a row, keep a rejection reason somewhere. If you collapse duplicates, keep a collapsed_from_retries indicator. The goal isn’t perfect traceability everywhere. The goal is to avoid irreversible cleaning that hides assumptions.
Bonus: Documentation is what makes the loop cheaper over time
Documentation is not a “final step.” It’s the thing that prevents the loop from resetting every few months. You should keep documentation early, and often.
Document insights, assumptions, and decisions, not just code
The most valuable line is often: “We treat negative amounts as reversals, not errors.” Or: “Duplicates represent retries; keep latest event per order.” Without that, the next person will “clean” your clean data in a different direction.
Keep a living cleaning report
One short page that stays up to date: what was discovered, what was confirmed, what was resolved, what remains uncertain. This is what keeps stakeholders engaged, and it’s what prevents your future self from starting over.
In AI-assisted workflows, documentation is leverage
There is no reason not to use AI to improve your documentation and keep it updated every day. Don’t wait the end of the project to do it.
In turn, good context makes AI tools dramatically more helpful. Poor context turns them into confident guessers.
Documentation is how you turn AI into a productivity multiplier rather than a source of new mistakes.
Conclusion: the takeaway mental model
Good data cleaning is not a sequence of operations. It is a learning loop:
Discovery surfaces surprises. Investigation turns surprises into knowledge. Resolution encodes that knowledge into the dataset.
It is also a team sport: project management and communication are key to making it smooth and enjoyable for everyone.
The best practices are simple on purpose:
discover earlier with a repeatable exploration pass
investigate faster with smaller evidence-based questions and a backlog
resolve safely by preserving meaning, traceability, and uncertainty
document decisions continuously so the loop gets cheaper over time
In the next post, we’ll go one step more practical: a case study of going through the whole iteration loop, from raw data to final report, with concrete actions and tooling.